Home

 
Section 3:
Means and Medians
Trial Award Patterns
Probability
Standard Deviation
Normal Distributions
Logarithms
Awards Test
 

Logarithms

Graphing the data

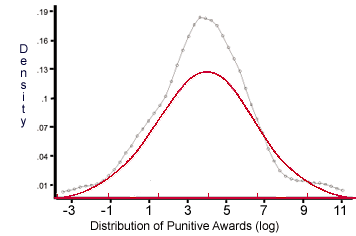
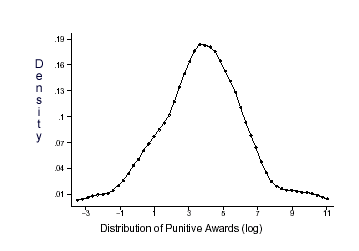
Figure 1 shows the distribution of the punitive awards (in logs), and compares it to a normal distribution (in red).

Unlike the untransformed variables, the logarithms of the variables behave reasonably similarly to a normal distribution.

 
Copyright © 2002 by Theodore Eisenberg & Kevin M. Clermont
Cornell University
Cornell Law School
Cornell University
Comments to ted@teddy.law.cornell.edu
Last updated: September 2002